


Looking to History for Clues of a New Rally
Uncertainty about the state of the U.S. and global economy, corporate profitability and spending of AI, as well as the forward path of inflation and U.S. Federal Reserve interest rate cuts led to a decline in the U.S. stock market. Currently, as of March 6 intraday, the S&P 500 is down -2.3%, the Nasdaq Composite is down –6.4% and the small cap Russell 2000 is down –7.3% for the year. The S&P 500 is testing its 200-DMA and looks increasingly likely to breach that level. As a result, we think it is a good time to re-circulate our study on U.S. market corrections and what to look for going forward.
The O’Neil Methodology believes that equity markets transition from a downtrend to an uptrend on a rally starting with what we term a Follow-Through Day (FTD). An FTD is a gain of 1.7% or more on volume above the prior day’s session and can occur only after the market has not made a new low for three days. Days 4–7 are typically the strongest FTDs.
There are two basic cases for corrections.
- Bull Case: A sharp correction and recovery, which eventually leads to new highs. This case hinges on whether or not one of the first two follow-through days (FTDs) are successful and eventually lead to new highs in the market
- Bear Case: A series of lower highs and lower lows. Should two follow-through days fail by undercutting previous set lows, historical precedence argues for a longer bear market scenario with more likely failed rally attempts.
We would note that our study is based on a starting point where the S&P 500 is coming from a well-established bull market, and closes below the 200-DMA and is at least 9% off highs. While we are not there yet, the S&P 500 has dropped 7% from highs currently, and it is possible it does not reach the 9% threshold. However, if it does breach the 200 DMA and falls over 9%, the statistics below become especially relevant.
On the S&P 500, there have been 35 corrections of at least 9% and a move below the 200-DMA since 1970. Of these:
- Scenario One – Bull Case #1: Nineteen had a first FTD, which resulted in the continuation of the bull market and eventual new highs.
- Scenario Two – Bull Case #2: Eight had a first failed FTD, but then a second, which resulted in the continuation of the bull market and eventual new highs.
- Scenario Three – Bear Case: Eight resulted in an eventual bear market. Of these, six had at least four failed FTDs. The years 1987 and 2020 were exceptions where the first FTD was never undercut.
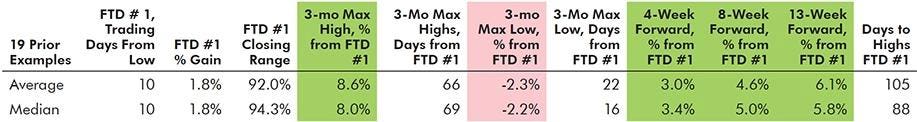
Scenario 1 – Bull Case #1: Nineteen Bull Market Corrections in which the First Follow-Through Day led to new Highs
The keys in this scenario include:
- No undercut of market lows established prior to the FTD.
- Strong progress made after the FTD, usually within 4–8 weeks. Conversely, at most only minor losses from the FTD close.
- Two examples where the first FTD translated to new highs include in November 2023 and 2004. See charts below.
Scenario 2 – Bull Case #2: Eight Bull Market Corrections with Undercut of Lows after First Follow-Through Day, but Successful Second Follow-Through Day
The keys in this scenario include:
- First FTD failure on an undercut of prior established lows.
- Exceptional progress was made after the second FTD, usually within 4–8 weeks. This is a V-shaped recovery concept.
- Examples include 2018 and 2010. See charts below.
Scenario 3 – Bear Case (Eight Corrections which led to Bear Markets)
The keys in this scenario include:
- Much worse typical performance after the first FTD within 4–13 weeks versus other two scenarios.
- Eventually, median of four+ failed FTDs over roughly a year and a half. Exceptions include 2020 and 1987 where the market crashed and the first FTD from the low held. Excluding those two, the median failed FTDs was six.
- In all examples, except for 2020 and1987, the second failed FTD was the differentiator between scenarios 1 and 2, and led to a bear market each time.
- The most recent example is 2022. See chart below.
Post FTDs, some distribution is normal. For the three scenarios, here are the historical distribution days within the first four weeks.
In Conclusion
While the forward path of the market is uncertain, we believe there is a high probability that the S&P 500 will break its 200 DMA. In that case, we will be looking for an FTD to occur. How this FTD occurs and what action the market takes immediately after it will determine our level of confidence in a new bull market emerging. To reiterate, often the first FTD fails but the second is successful and leads to a strong rally. If this does not happen, an extended bear market may arrive. For now, we suggest investors proceed with caution until positive O’Neil Methodology technical signals occur. The S&P 500 and Nasdaq both made a new intraday low on Friday. If they close in the upper half of the daily range, (considered day one off lows), and do not make another new low, then an FTD could occur as early as next Wednesday (day four). If they do not close in the upper half of the range, but also do not make another new low, the FTD could occur as early as next Thursday.
Kenley Scott, Director, Global Sector Strategist at William O’Neil + Company, an affiliate of O’Neil Global Advisors, made significant contributions to the data compilation, analysis, and writing for this article.
The William O’Neil + Co. Research Analysts made significant contributions to the data compilation, analysis, and writing for this article.
Disclaimer
No part of the authors’ compensation was, is, or will be directly or indirectly related to the specific recommendations or views expressed herein. William O’Neil + Co., its affiliates, and/or their respective officers, directors, or employees may have interests, or long or short positions, and may at any time make purchases or sales as a principal or agent of the securities referred to herein.
William O’Neil + Co. Incorporated is an SEC Registered Investment Adviser. Employees of William O’Neil + Company and its affiliates may now or in the future have positions in securities mentioned in this communication. Our content should not be relied upon as the sole factor in determining whether to buy, sell, or hold a stock. For important information about reports, our business, and legal notices please go to www.williamoneil.com/legal.
©2025, William O’Neil + Company, Inc. All Rights Reserved.
Read the full article here


