The Survey Research Center (SRC) at the University of Michigan is a well-known survey research entity. In the 1960s, it boasted one of the best survey sampling experts (Leslie Kish) and a permanent interviewing staff, conducting surveys on numerous topics. The Survey of Consumer Finances, focusing on consumer behavior, was an exceptionally long survey based on about 1,500 in-person interviews randomly selected across the U.S. The survey took a long time to complete (an hour was not unusual) and interviewers could make as many as 10 attempts to get an interview. Response rates ran near 100% (the Federal Reserve now does this survey via telephone. See “Bias and Callbacks in Sample Surveys,” Journal of Marketing Research, William Dunkelberg). Respondents were more patient and available in those days.
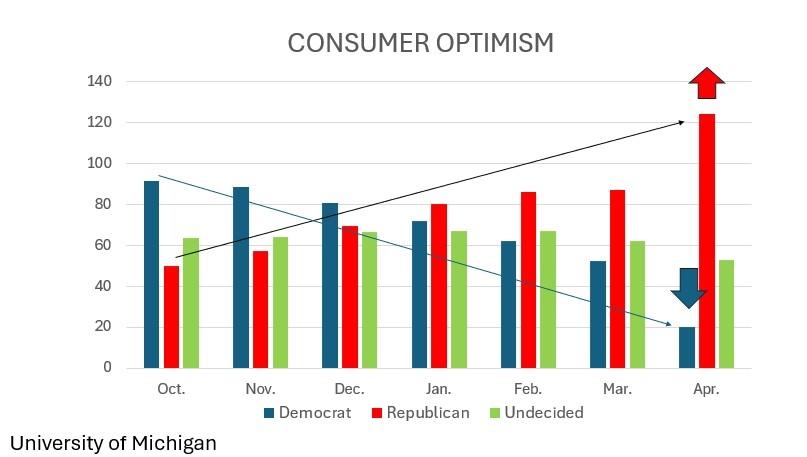
The SRC still conducts monthly surveys about consumer sentiment (developed by Dr. George Katona), that are closely followed by financial analysts and the press. The March survey revealed a large change in sentiment over the past six months, with the Index of Consumer Sentiment declining from 70.5 in October to 57.0 in March. With information about each respondent, researchers can examine in more detail the sources and causes of these changes. During the last six months, we had an election, and the impact of the election varied by respondent characteristics, including political affiliation. Indeed, the Index fell from 91.4 to 41.3 for Democrats (a drop of 50.1 points) but rose from 53.6 to 87.4 for Republicans (a gain of 30.8 points). Votes cast by Republicans far outnumbered those cast by Democrats in the election. If the University of Michigan’s sample had equal numbers of both (the Index for Independents barely changed), overall sentiment would have risen, not plunged.
NFIB’s Small Business Optimism Index is constructed from 10 variables that are forward-looking or supportive of hiring and spending. The Index provides a monthly summary data point for the state of the small business economy. From October 2024 to March 2025, the Index rose from 93.7 to 97.4; the 51-year average is 98. The survey is based on a random sample of member firms and questionnaires are mailed twice to increase the response rate. Until the election, the Index was below 98, remaining below 94 for over a year. Although most of the Index components rose, the dominant components were Expected Business Conditions and Expected Real Sales. Clearly the election outcome changed owners’ expectations about the future economy. Historically, the correlation between the Index and business spending is positive, an increased willingness to spend and hire. However, this time there was a large increase in uncertainty. NFIB’s Uncertainty Index (based on the frequency of “uncertain” and “don’t know” responses to six questions) rose to a record-level of 110 in October 2024. It then fell to 86 after the election, and later rose to 104 in February (the second highest reading) as the Administration announced an avalanche of policy changes. As Congress and the President reach agreements, uncertainty will recede.
Read the full article here


